| County Population Summary | |
|---|---|
| 2000 Total Population | 36,051 |
| 2010 Total Population | 35,625 |
| 2012 Total Population | 35,706 |
| County Median Age | |
|---|---|
| 2010 | 37.3 |
| 2012 | 38.1 |
| 2017 | 38.9 |
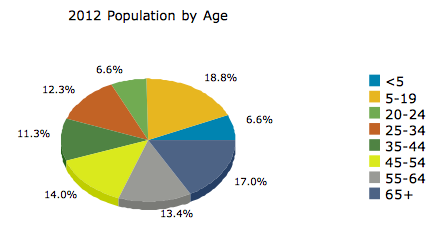
| County Population by Age | 2010 | 2012 |
|---|---|---|
| Total | 35,625 | 35,706 |
| 0 - 4 | 6.6% | 6.6% |
| 5 - 9 | 6.3% | 6.2% |
| 10 - 14 | 6.0% | 5.9% |
| 15 - 24 | 13.5% | 13.3% |
| 25 - 34 | 12.1% | 12.3% |
| 35 - 44 | 11.7% | 11.3% |
| 45 - 54 | 14.5% | 14.0% |
| 55 - 64 | 12.9% | 13.4% |
| 65 - 74 | 8.0% | 8.5% |
| 75 - 84 | 5.8% | 5.8% |
| 85 + | 2.7% | 2.8% |
| 18 + | 77.2% | 77.6% |
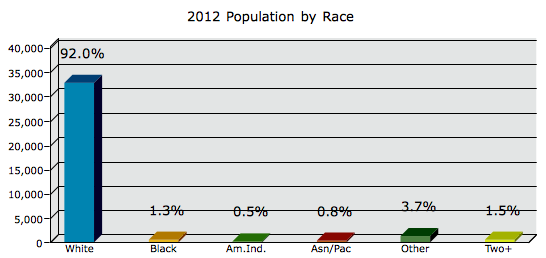
| County Population by Race/Ethnicity | 2010 | 2012 | 2017 |
|---|---|---|---|
| Total | 35,625 | 35,706 | 35,610 |
| White Alone | 92.1% | 92.0% | 92.0% |
| Black Alone | 1.4% | 1.3% | 1.4% |
| American Indian Alone | 0.5% | 0.5% | 0.5% |
| Asian Alone | 0.7% | 0.7% | 0.7% |
| Pacific Islander Alone | 0.1% | 0.1% | 0.1% |
| Some Other Race Alone | 3.7% | 3.7% | 3.7% |
| Two or More Races | 1.5% | 1.5% | 1.6% |
| Hispanic Origin | 9.1% | 9.2% | 9.2% |
| City | Median Income | Per Capita Income |
|---|---|---|
| 2012 | $36,807 | $23,135 |
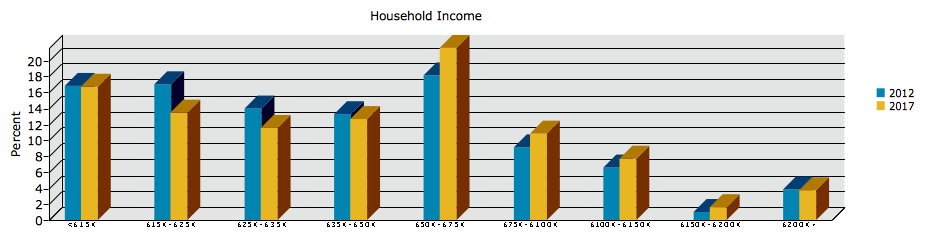
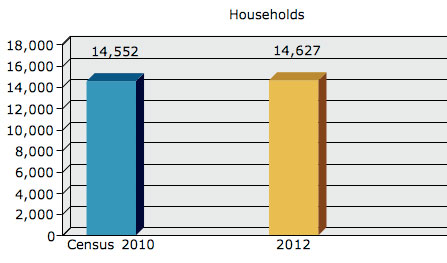
| City Households by Income | 2012 |
|---|---|
| Household Income Base | 14,627 |
| <$15,000 | 16.8% |
| $15,000 - $24,999 | 17.1% |
| $25,000 - $34,999 | 14.0% |
| $35,000 - $49,999 | 13.3% |
| $50,000 - $74,999 | 18.1% |
| $75,000 - $99,999 | 9.1% |
| $100,000 - $149,999 | 6.6% |
| $150,000 - $199,999 | 1.1% |
| $200,000+ | 3.9% |
| Average Household Income | $55,792 |